Pert Chart
The Program Evaluation and Review Technique (PERT) is a method to analyse the tasks iinvolved in completing a given project and identifying the minimum time needed to complete the total project. PERT was developed for the planning and scheduling of very large-scale, one-time, complex, non-routine projects. It can incorporate uncertainties and this allows it to schedule a project while not knowing precisely the details and durations of all the activities.
Terminology
- PERT event: A point that marks the start or completion of one or more tasks. It consumes no time and uses no resources.
- Predecessor event: An event that immediately precedes some other event. It is usually the consequence of one or more activities.
- Successor: An event that immediately follows some other event. It is usually the consequence of one or more activities.
- PERT activity: The actual performance of a task. It consumes time and requires resources to move from one event to another.
- Optimistic time (O): The minimum possible time required to accomplish a task, assuming everything proceeds better than is normally expected.
- Pessimistic time (P): The maximum possible time required to accomplish a task, assuming everything goes wrong (but excluding major catastrophes).
- Most likely time (M): The best estimate of the time required to accomplish a task, assuming everything proceeds as normal.
- Expected time (TE): The best estimate of the time required to accomplish a task, assuming everything proceeds as normal. TE = (O + 4M + P) ÷ 6.
- Critical Path: The longest possible continuous pathway taken from the initial event to the terminal event. Any time delays along the critical path will delay the overall project completion by at least the same amount.
- Critical Activity: An activity that has its float equal to zero.
- Lead time: The time by which a predecessor event must be completed in order to allow sufficient time for the activities that must elapse before a specific PERT event is to be completed.
- Lag time: The earliest time by which a successor event can follow a specific PERT event.
- Slack: A measure of the excess time and resources available in achieving this event. It is the amount of time that a task in a project network can be delayed without causing a delay. Slack = LF - EF.
Implement PERT
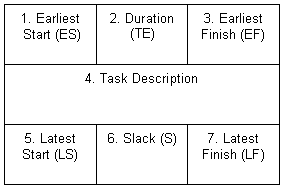
The PERT diagram comprises of a network of nodes connected by arrows. Each node may contain up to 7 items of information.

- Earliest start time for the task.
- Duration required to complete an task of work.
- Earliest finish time for the task.
- Descriptive information about the task.
- Latest start time for the task.
- Time available for a task before it must begin or finish so that it will not affect the project completion time.
- Latest finish time for the task.
How to construct a PERT chart
- Identify the tasks that the project requires and the order (predecessor, successor) in which they must be completed.
- Estimate the Expected time to complete each activity, using the TE = (O + 4M + P) ÷ 6.
- Draw a starting node with duration of zero.
- Draw each activity that and connect them with an arrow based on their order.
- Complete the diagram with a finish node.
- Determine ES, defined as the maximum EF of all predecessor activities.
- Determine EF, defined as ES plus the duration.
- Determine LF, defined as the minimum LS of all successor activities (For the last activity, LF = EF).
- Determine LS, defined as LF minus duration.
- Determine the path times by adding the task durations for all available paths.
- Determine the critical path. The critical path is the path that takes the longest to complete. (Note that there can be more than one critical path or critical path may change especially for complex projects).
- Determine slack, defined as LF - EF or LS – ES.
Example
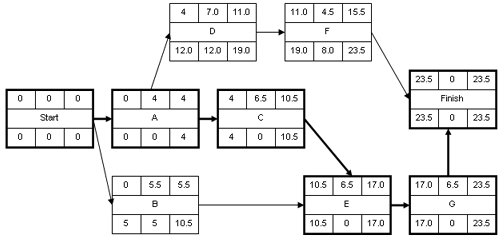
This example has seven tasks, labeled a through g. Some tasks are independent while others cannot be done until their predecessor task is completed. The optimistic time, the normal time estimate and the pessimistic time are estimated. The expected time (TE) is computed using the formula (O + 4M + P) ÷ 6.
| Activity | Predecessor | Optimistic Time | Normal Time | Pessimistic Time | Expected time |
| A | 2 | 4 | 6 | 4.0 | |
| B | 3 | 5 | 10 | 5.5 | |
| C | A | 3 | 7 | 8 | 6.5 |
| D | A | 4 | 7 | 10 | 7.0 |
| E | B, C | 3 | 7 | 8 | 6.5 |
| F | D | 3 | 4 | 8 | 4.5 |
| G | E | 3 | 7 | 8 | 6.5 |
