Process Mapping
Process Mapping (also known as process charting or flow charting) is one of the most frequently used tools for process analysis and optimisation. A process map is a graphical representation of a process. It can represent the entire process at a high level or sequence of task in a detailed level. A process map usually shows inputs, pathways, decision points and outputs of a process. It may also include information such as time, inventory, manpower, etc. A good process map should allow people who are unfamiliar with the process to understand the workflow. It should be in the appropriate level of detail and contain critical information like inputs, outputs, time, etc to aid further analysis.
Process Mapping Essentials
To get the most out of process mapping, it is important to take into consideration the following:
- Use the appropriate type of process map
- Get experienced facilitation for best results
- Identify the product or service clearly to determine the related sequence of events that produce the product or service
- Set clear boundaries or start/end points for the process
- Mapping should be conducted together with people involved with the process
Process Mapping Symbols
The following are some of the commonly used symbols used to create process maps. A description of what each symbol represents and commonly used for is provided but it is not definite. The symbols can be used to represent other actions as long as the definition is commonly understood and consistent.
| Symbol | Name | Description |
 |
Process step | Represents a process step or task. This is the most commonly used symbol. |
 |
Decision | Represents a decision point or a branch in the process where usually there are two options (Yes/No, Pass/Fail). |
 |
Subroutine (Predefined Process) | Represents a formally defined process or a series of steps documented elsewhere. |
 |
Delay | Represents any form of delays or waiting in the process. |
 |
Input/Output (Data) | Represents the inputs in or outputs from a process. |
 |
Document | Represents a process step that produces a document. |
 |
Database (Magnetic Disk) | Represents a database or where data is stored. |
 |
Start/End (Terminator) | Represents the start or stop points in a process. |
 |
Connector | Used to connect one point in the process map to another to avoid drawing flow lines all over and crossing each other. They are usually labeled for easy reference. |
 |
Off-Page Connector | Used to connect a process to another page. |
 |
Extract | Represents the extraction of data or objects from a process. |
 |
Merge | Represents the merging of process flows or steps. |
 |
Sort | Represents a process step to sort data or materials, etc. |
 |
Collate | Represents a process step to organise data or materials, etc. |
 |
Display | Represents a process step where data or information is displayed. |
 |
Alternate Process | Represents an alternative process step to the normal process. |
 |
Manual Input | Represents a process step where manual input of data or materials is required. |
 |
Manual Loop | Represents a process step that is not automated and a looping operation takes place. |
 |
Preparation | Represents a process step that is of a preparation nature such as machine set-up. |
 |
Stored Data | Represents a process step that stores data. |
 |
Multi-documents | Represents a process step that produces several documents. |
 |
Card | This is an old symbol used to represent a card used for machines. |
 |
Punched Tape | This is an old symbol used to represent punched tapes that are used are inputs to a machine. |
 |
Summing Junction | Used to connect several branches converging into the process. |
 |
Or Junction | Used when a process diverges into several branches. |
Types of Process Map
As-Is Process Map - The As-Is (also called Present State) process map is a representation of how the current process worked. It is important that this process map shows how the process works to deliver the product or service to the customer in reality, rather than how it should have been. This process map is very useful for flushing out issues in a process and also giving everyone a good understanding of the process they are targeting.
To-Be Process Map - The To-Be (also called Future State) process map is a representation of how the new process will work when the improvements were implemented. This process map is useful for visualizing how the process will look like after improvement and making sure the events flows in sequence.
Ideal Process Map - The ideal process map is a representation of how the process will work in an ideal situation with the constraints of time, cost and technology. This process map is useful to help teams challenge the current paradigm and get really creative on how they can change the process.
Multi-level Process Map
A multi-level process map is made up of several process maps of increasing level of detail. At a macro-level, the process map can describe the core process, end-to-end, in a handful of step. At this level, it is common that only the “Process step” symbol is used and the steps are mapped in a linear manner. Any process step can be expanded to reveal more details as another process map in the next level and so on. It can go into micro-level where individual steps in a task are depicted in sequence. The multi-level process map is useful because it provides the flexibility of going into the details on process steps of interest. This not only saves time but also creates a process map that is useful as a communication tool to various levels of people in the organization.

Cross-Functional Process Map
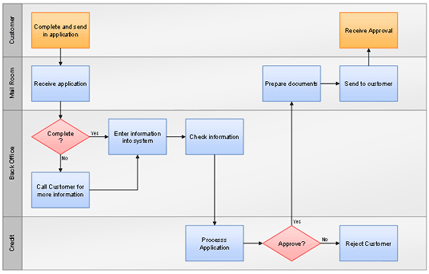
When a process involves a number of different people or functional units, it may be better to use a cross-functional process map to track who is responsible for each step. The cross-functional process map also make it easier to track the number of hand-offs (control of the process is passed to another person) which are usually sources of errors and waste. The functional lanes (also called swim lanes) represent the different people or functional units involved. Process mapping is done as usual and process steps are placed in the lanes of the functional unit who are responsible for.

Value Stream Map
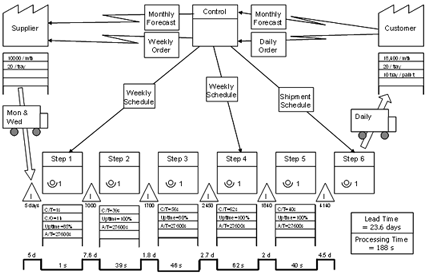
The Value Stream Map is a Lean tool used to understand the flow of materials and iinformation through the value stream to produce a product or service to a customer. It is commonly used to identify opportunities for improvement in lead time. A value stream map tends to be a macro-level map and contains much more information than a typical process map. It is often used to identify bottlenecks in the process and areas that requires iimprovement which leads to Kaizen Events or improvement projects.
There are different symbols used in a value stream map and a brief description is shown in the table below.
| Symbol | Name | Description |
 |
Process | Represents a process or operation through which the material flows. Usually, detailed process steps are not shown unless there are significant inventory build up or batch transfers. |
 |
External Sources | Represents the supplier or the customer. The supplier is the start point and it is usually placed on the upper left of the map. The customer is the end point and it is usually placed on the upper right. |
 |
Shipment | Represents the transportation of materials from an external source or finished goods to the customers. |
 |
Data Box | This symbol is placed under any symbol to display critical information. Typically it displays information such as frequency of shipment, batch size, material information underneath external sources symbol. For the process symbol, it typically display information such as cycle time, change over time, uptime, processing time, available capacity, batch size, yield, etc. |
 |
Inventory | Represents the level of inventory before a process. The level of inventory is displayed below the symbol. |
 |
Operator | Represents operator(s). The number of available operators is shown below the symbol. |
 |
Push Arrow | Represents the movement of materials from one process to another. It is used when the previous process ‘pushes’ materials to the next process regardless of whether it is needed by the next process. |
 |
FG to Customer | Represents movement of finished goods to the customer. It can also be used to represent movement of raw materials from the supplier to the factory. |
 |
Electronic Information Flow | Represents an electronic flow of electronic data or information. |
 |
Manual Information Flow | Represents the general flow of information. |
 |
Withdrawal | Represents the pull of material, usually from the supermarket. |
 |
FIFO | Represents first-in-first-out inventory. |
 |
Withdrawal Kanban | Used to signal withdrawal of parts from a supermarket. |
 |
Production Kanban | Used to signal an upstream process to produce parts for a downstream process, usually a pre-defined quantity. |
 |
Kanban in Batches | Represents Kanbans arriving in batches. |
 |
Kanban Post | Represents a location where Kanbans are placed. |
 |
Signal Kanban | Used to signal a process to change over and start production of a particular part. This is typically used when the inventory level in the supermarket drops below the minimum level. |
 |
Sequence Pull Ball | Represents a pull system that signals a supplying process to produce a predetermined type and quantity of part, without using a supermarket. |
 |
Supermarket | Represents a stock of inventory where the next process or customer can draw upon when required. The upstream process will replenish the stock when it runs low. It is used to reduce overall inventory level and when a continuous flow is not possible. |
 |
Buffer | Represents safety stock required to continue production against problems such as downtime or fluctuations in demand. |
 |
Load Levelling | Used to batch Kanbans to level the production volume and mix over a period of time. |
 |
Schedule | Represents a production scheduling operation or unit. |
 |
Go See Scheduling | Represents a visual inspection or gathering of information. |
 |
Kaizen | Used to highlight areas that required improvement and plan Kaizen Events to do so. |
 |
Timeline (Value Add Time) | Represents a timeline where activities are considered as value-adding. |
 |
Timeline (Non Value Add Time) | Represents a timeline where activities are considered as non value-adding. |
Example

Facilitation
Process mapping is more effective when conducted in a group and in a group setting, good facilitation is essential. The facilitator must be able to steer the proceeding of the event, challenge conventional wisdom and keep the group focused on the objective. The group must be made up of people with domain knowledge but this is not necessary for the facilitator. In fact, the lack of experience forces him to clarify and question the current paradigm. The following are general good practices in process mapping facilitation:
- Identify target process/product and establish clear objectives for the event
- Determine the boundaries and make sure the scope is manageable to be completed within the event
- Prepare the room and a big piece of paper for mapping
- Open the event and brief all members of the objective and ground rules
- Chart the process
- Clarify and add in more details
- Summarise, ask for feedback and plan the next steps
Demo Video
Draw as you type
Draw using the toolbar
Draw using the toolbar