Statistical Process Control
Statistical Process Control (SPC) is a method of monitoring a process by using control charts. Conventionally, quality is ensured through inspection of the finished product. SPC on the other hand, uses statistical tools to observe the performance of the process in order to detect signs of deviations early. Sampled data are collected from the process and monitored so that variations can be detected and addressed early, thereby reducing waste, cycle time and defects downstream. SPC was developed by Walter Shewhart in the early 1920s. He concluded that while all processes displays variations, some variations are natural to the process (common causes of variation), while others are not present in the process causal system at all times (special causes of variation). SPC was later used and popularised by Edwards Deming in the in the 1950s in US and Japan. Although SPC has its roots in manufacturing, the principles of SPC can be successfully applied to the service environment too. SPC not only indicates when an action should be taken, but also when not to. For example, iif deterioration of quality is detected due to the wear and tear of product equipment, then preventive actions like equipment maintenance should be taken. On the other hand, if the service delivery time varies within control, to increase manpower for the process may be overreacting.
Control Charts
Control charts are used for monitoring process statistics and detecting the presence of special causes. It can be used to determine if a process is in control before determining the process capability.
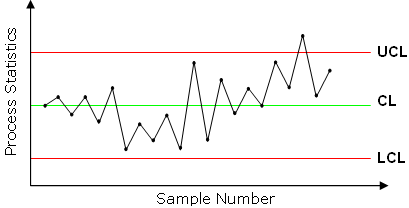
The process statistic can be the subgroup means, individual observations, number of defects or defective units and it is plotted against the sample number. The average of the statistic is plotted as the centre line along with the upper and lower control limits.
Common and Special Cause Variation
Common cause variations (also called random variations) are systemic variations that affect almost every result. When only common cause variation exists in the process, the process is deemed in-control, stable and predictable over time. Special cause variations are sporadic or exceptional variations. They do not happen all the time and it could be a temporary deviation (e.g. an outlier) or a permanent deviation (e.g. a process change). When special cause variation exists in the process the process is deemed to be out-of-control and unstable over time. Although customers do not care whether problems are due to common causes or special causes, it is important to determine what type of variations is dominant in the process because improvement strategy differs.
Improvement Strategy
The first step to improvement is to make sure that all the data used to monitor the process are timely, accurate and relevant. If common cause variation is dominant, it is likely that a fundamental change in the process is required if improvement is sought after. The process needs to be looked in detail and properly redesign to meet new specifications. Tampering with the process may not result in positive changes to the process performance. If special cause variation is dominant, the most effective way is to immediately investigate the event that took place when the signal is shown and prevent it from happening again. This may often require changes in other processes to prevent the special cause from recurring. It is important not to ‘over-fix’ special causes or make fundamental changes to the process for it.
Caution
- The belief that control charts are only suitable for high volume processes is a myth. By choosing a suitable type of control chart and size of the samples can improve the sensitivity of the chart. As a rule of thumb, 20 to 30 data points are required for plotting control charts.
- An in-control process does not necessary meet customer requirements. Controls limits are different from specification limits because the former are computed from the sampled data and the latter are determined by voice of the customers.
- Having tighter control limits does not necessary mean better control of the process. Every process has its inherent variation and having control limits too narrow may create unnecessary false alarms.
- An out-of-control process is not always bad. Process may experience a positive shift in mean or shrink in variance due to process improvement efforts which are desired. When the improved process is stable, new control limits may be calculated.