Variables Control Charts
Variables control charts plot statistics such as time, length or weight in the form of subgroup means, individual observations, or weighted statistics.
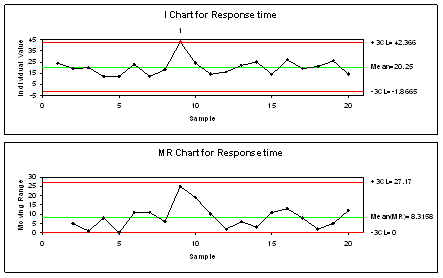
I, MR and I-MR Charts
The Individuals (I) Chart is a control chart of individual observations and the Moving Range (MR) Chart is a control chart of moving ranges. They are used to track process level and process variation respectively and detect signs of special causes when subgroup size is equals to 1. The I-MR Chart is a combination of the I and MR charts.
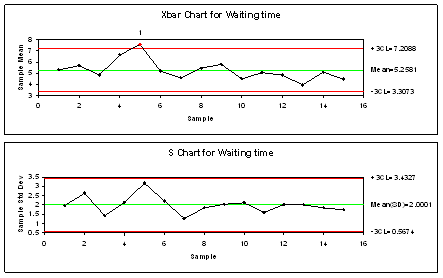
Xbar, R, S, Xbar-R and Xbar-S Chart
The Xbar Chart is a control chart of subgroup means and it is used to track the process level and detect signs of special causes. The R Chart is a control chart of subgroup ranges and the S Chart is a control chart of subgroup standard deviations. They are used to track the process variation and detect signs of special causes. The R-chart is more suitable for sample sizes 5 or less, otherwise, the S Chart may be more appropriate. The Xbar-R and Xbar-S charts are combination of the Xbar, R and S charts.
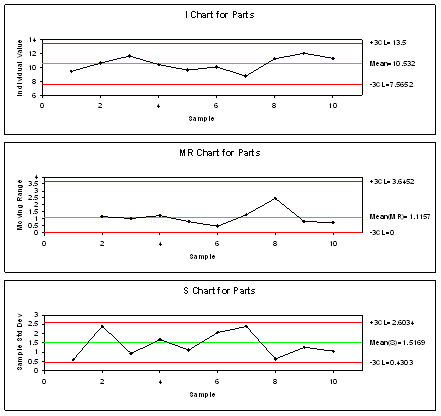
I-MR-R/S Chart
The I-MR-R/S uses both between-subgroup and within-subgroup variations to generate three control charts, the individuals, moving range and R or S charts. These three charts can help to assess the process level, variation between samples and variation within samples respectively. It is useful when the overall process variation is due to both between subgroup variation and random error.
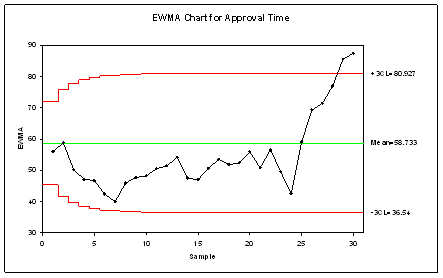
MA and EWMA Chart
The Moving Average (MA) Chart is a control chart of moving averages (of individuals or subgroup means). The EWMA Chart is similar but the moving averages are exponentially weighted. Each point in the EWMA chart contains a weighted effect from all the previous points. Both charts are used to track process level and detect minor shifts away from the target.